Instructions

Using the Visualization

This website provides a searchable, interactive visualization of the ~2,700 ASL signs contained in the ASL-LEX 2.0 database. The visualization provides two ways to view the sign data: the Network Graph and the Scatterplot View.

Network Graph

The network graph is the primary way to visually explore the information in the ASL-LEX database. This view allows you to see the lexicon as a whole, filter for signs with specified properties, obtain detailed information about individual signs, and see how signs are related to each other.

  • Signs as Nodes

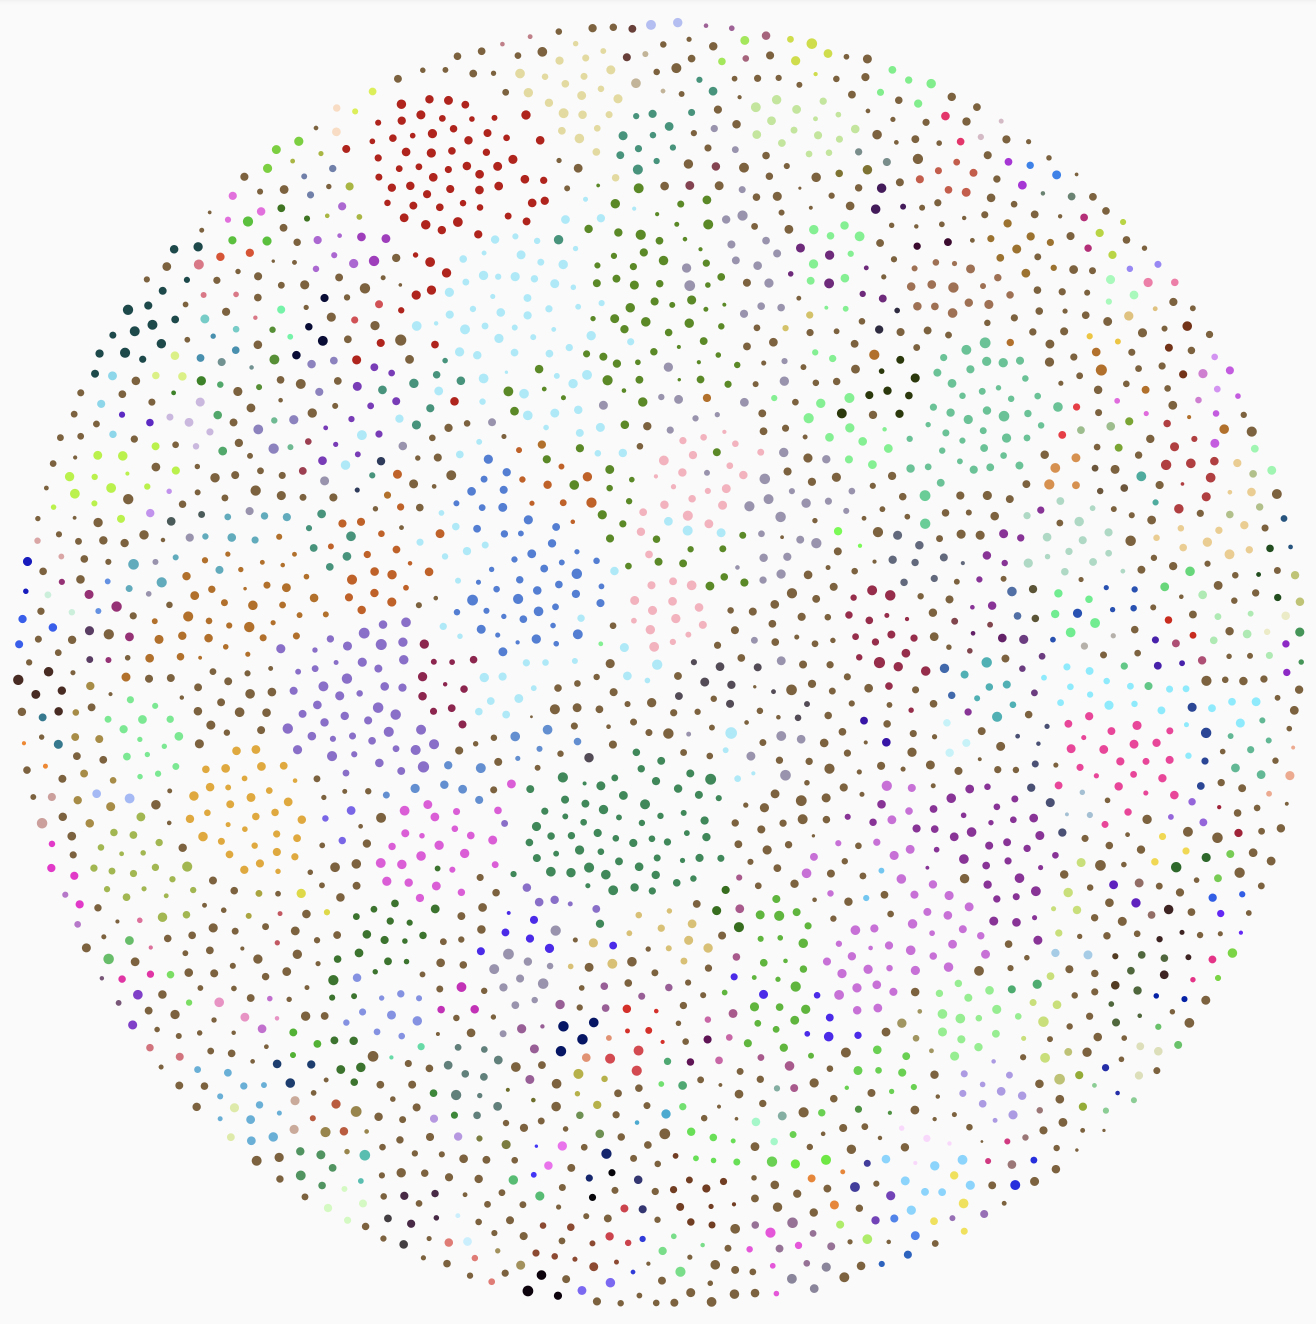
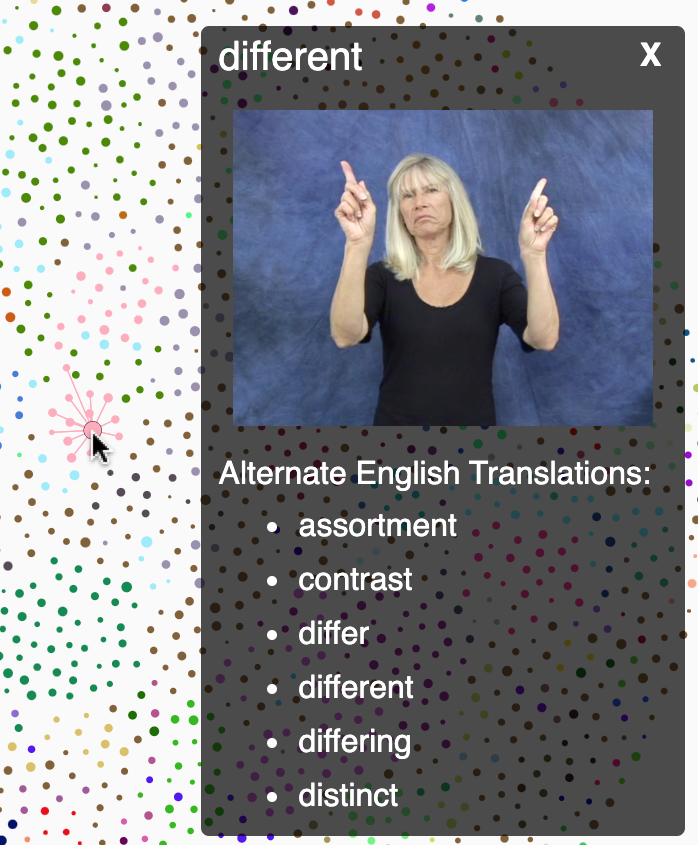
In this visualization, each sign is represented as a node. Higher frequency signs have larger nodes while lower frequency signs are smaller.

Signs are arranged spatially based on phonological relatedness. The ASL-LEX 2.0 visualization uses 16 phonological features to determine relatedness; signs that share more phonological features appear closer to each other than signs that share fewer features. Signs that are very closely related—phonological 'neighbors', differing by at most 1 phonological feature—are connected to each other by an edge. Edges appear when hovering over a node. Nodes are roughly colored roughly by phonological neighborhood.

Note: Due to the complexity of the visualization, nodes will not always appear exactly as described above. For example, the distance between two nodes may not exactly reflect their phonological similarity as their position in the visualization must optimize their distance to all other nodes. Similarly, nodes may belong to more than one phonological neighborhood but will receive only one color.

  • Navigation

Users can zoom in and out of the visualization by using the mouse scroll wheel or the scroll gesture on a trackpad (e.g., two finger slide on a Mac). The zoom will be centered on the mouse cursor. Clicking and dragging when the cursor is an arrow or the I-beam cursor (Graphic of the I-Beam text cursor) will allow you to pan around the visualization.

Hovering the cursor over a node will will provide a preview of its reference video and alternate English translations. Clicking on a node will zoom and center the visualization on that node and will cause information about that sign to appear in the Sign Data menu. Sign data can also be viewed for multiple signs at the same time: when the cursor is a crosshair (+), simply click and drag to select the desired signs then click View Options.

The visualization may be reset to its original state by clicking the "Reset Graph" button at the top right of the webpage.

    To search for individual signs, click the Show Menu button at the top left of the webpage. Enter the English translation of the sign in the textbox. As you type, signs that match your query will be shown; click on the sign from the list that you wish to see. Once you have clicked on a sign, its node will be centered in the network view and information about the sign will appear in the Sign Data menu.

    Note on English Glosses (Translations)

    The primary purposes of the glosses used in this database (called “EntryID” glosses in the database) are to uniquely identify each sign in the database and to provide a convenient way to search for signs. While these glosses were selected to evoke the meaning of the signs, they may not be accurate translations as meanings can change with context.

  • Filters

    In addition to searching for specific signs, signs can be filtered by any of the properties listed in the database. This allows users to find all signs matching a particular set of properties, for example all signs with Frequency > 5. To filter by property, click on the Filters button in the menu, specify the desired value(s) for the desired property, and click Submit. Information about individual properties can be accessed by hovering over the ⓘ symbol adjacent to each filter.

    Once filter values are set, only the nodes that match those properties will remain colored in the visualization; signs that do not match the criteria will have their nodes greyed out. The number of nodes satisfying the filter criteria and a list of active filters are provided just below the Filters button.

    To restore signs, click the Remove Filter link beneath each set filter or click the Reset Graph button at the top right of the webpage.

Scatterplot View

The Scatterplot View allows you to explore the relationships between different properties of ASL signs. Relationships can be viewed for the lexicon as a whole or for selected subsets of signs.

  • Scatterplot View

The basic scatterplot view is reached by clicking 'View Scatterpots' at the top right of the visualization. Pairwise scatterplots for 4 variables are shown: Sign Frequency, Iconicity, Lexical Class, and Neighborhood Density. Hovering over a scatterplot will highlight the signs beneath the cursor and show their EntryID in the pane at left.

Signs can also be selected by clicking and dragging over a scatterplot. From there, you can choose to see this subset of signs in the network graph or view a table of their properties.

  • Scatterplot View

It is also possible to view scatterplots for only a specific subset of signs. To select the subset, start in the Network View and click and drag over the desired sign nodes. Then select "View scatterplots" from the View Options button that appears. The scatterplots that are shown will contain only the selected signs. This method is useful for exploring the properties of a particular neighborhood, for example.